
Think of the marketing research process as a six-step journey that turns hazy business questions into a clear, actionable strategy. It’s a proven path: define the problem, design the research, collect the data, analyze what you’ve found, report the findings, and then—most importantly—take action. Following these stages is what separates decisions based on solid evidence from shots in the dark.
Why a Structured Research Process Is Your Secret Weapon
Guesswork is the enemy of growth. When you’re making big decisions based on a gut feeling or what worked last year, you’re essentially navigating a maze blindfolded. A structured research process is your map and compass, making sure every step you take is deliberate and moves you closer to your goal.
This systematic approach isn’t some new fad; it’s the modern version of a century-old mission to figure out what makes customers tick.
From Old-School Ad Theories to AI-Powered Insights
The need for a clear process has deep roots. Back in the 1920s, a psychologist named Daniel Starch came up with a theory that for an ad to actually work, people had to see it, read it, believe it, remember it, and finally, act on it. That five-part journey was an early mirror of today's marketing research stages—defining a problem, gathering data, and driving action.
This foundational idea helped kickstart an entire industry. By 1947, marketing research was a $50 million business, with over 200 dedicated firms in the U.S. where almost none existed just two decades earlier. This history lesson isn't just trivia; it shows why each stage is a critical building block. Skipping a step is like trying to build a house without a foundation. It’s just not going to hold up.
The Modern Advantage
Today, the core principles are the same, but the tools are on a completely different level. Researchers used to spend weeks manually counting responses on paper surveys. Now, teams use powerful platforms to gather and analyze data pretty much instantly.
A structured process doesn't just keep your work organized; it multiplies the value of your tools. It ensures that the powerful data you collect is aimed at solving the right problem, leading to insights that actually move the business forward.
This is where having a solid process and great technology really pays off. For instance, teams using an AI-powered form builder can automate huge chunks of the data collection and qualification puzzle. A tool like Orbit AI can turn a simple survey into an intelligent conversation, capturing richer data and flagging high-intent leads on the spot.
This is how the classic marketing research stages become a high-speed engine for growth. You take a reliable, time-tested structure and pair it with tools that make the whole workflow faster and cleaner.
You can also learn more about how to streamline these efforts in our guide to marketing automation best practices.
Stage 1: Define Your Research Problem and Objectives
Every great marketing research project begins with a great question. Not an answer, not a solution, but a sharp, well-defined question. This first stage is the bedrock for everything that follows. It's the difference between vaguely saying, "we need more sales," and plotting a precise course to a specific treasure chest on a map. One leads to a long, meandering journey; the other leads to results.
A poorly defined problem is the #1 reason research initiatives crash and burn. I've seen it happen countless times: teams get excited, jump straight into designing surveys, and start collecting data without a crystal-clear "why." They end up with a mountain of interesting-but-useless information, having wasted weeks of time and thousands of dollars.
The goal here is to transform a broad business headache into a focused, researchable problem.
Take a common business challenge like declining sales. That's a symptom, not a diagnosis. A strong problem definition drills down to find the cause.
- Vague Business Challenge: "Our sales are down this quarter."
- Specific Research Problem: "Which customer segment has the highest churn rate in the last six months, and what are the primary drivers of their decision to leave?"
That simple shift changes everything. It turns a foggy complaint into a question we can actually answer. It sets clear boundaries and points the entire research effort in a single, productive direction.
From Broad Problems to SMART Objectives
Once you have a clear research problem, the next step is to break it down into specific, manageable objectives. A fantastic framework for this is setting SMART goals. This ensures each objective is Specific, Measurable, Achievable, Relevant, and Time-bound, bringing a crucial layer of clarity to the process.
Let's walk through a real-world example. Imagine a SaaS company is struggling to convert free trial users into paying customers.
The Big Picture Problem: Not enough free trial users are upgrading to a paid subscription. This is a huge issue, but it's too broad to research effectively.
To fix this, the team needs to get specific. Here's how they could break it down:
- Define the Research Problem: "Determine the key friction points and perceived value gaps in the user onboarding experience that cause trial users to abandon the product within the first seven days."
- Set SMART Objectives:
- Specific: Identify the top three features that trial users engage with most and the top three they ignore entirely.
- Measurable: Achieve a 15% response rate on a user feedback survey sent to all churned trial users from the last 30 days.
- Achievable: Conduct ten 30-minute in-depth interviews with recently churned users to gather qualitative stories and feedback.
- Relevant: Pinpoint the exact stage in the onboarding funnel with the highest user drop-off rate.
- Time-bound: Complete all data collection and initial analysis within three weeks.
This process creates an actionable roadmap. The team now knows exactly what information they need, who they need to talk to, and when they need it. Getting this right prevents scope creep and ensures every subsequent action is laser-focused on solving the real business problem. If you need help identifying the right people for your research, check out our guide on creating a lead qualification criteria framework.
Getting this stage right is about translating messy business challenges into focused research questions. Here’s a quick look at how that transformation works in practice.
Translating Business Challenges into Research Objectives
This table illustrates how to convert broad business problems into specific, actionable research objectives that guide the entire marketing research process.
| Vague Business Challenge | Specific Research Problem | Clear Research Objective |
|---|---|---|
| "Our new product isn't selling as expected." | "What is the primary barrier to adoption for our new product among our target audience of small business owners?" | "Identify the top three perceived weaknesses (e.g., price, features, complexity) of the new product by surveying 200 small business owners who viewed the product page but did not purchase, and conduct 15 follow-up interviews with non-purchasers to understand their reasoning." |
| "We're losing market share to a new competitor." | "How does our brand perception and value proposition compare to Competitor X in the eyes of our shared customer base?" | "Measure brand awareness, perceived value for money, and feature satisfaction for our product versus Competitor X through a comparative survey of 500 customers who have used both products in the last year, to be completed by the end of Q2." |
| "Our social media engagement is low." | "Which content formats and topics generate the highest engagement (likes, shares, comments) from our key demographic on Instagram and TikTok?" | "Analyze the performance of the last 100 social media posts to identify the top 5 performing content themes. A/B test three new content formats (e.g., short-form video, infographics, user-generated content) over the next 30 days to measure their impact on engagement rate." |
As you can see, the process moves from a vague sense of unease to a concrete plan of action. This clarity is what separates research that delivers real value from research that just creates reports.
This diagram shows how marketing research has evolved from foundational theory to today's AI-driven insights.
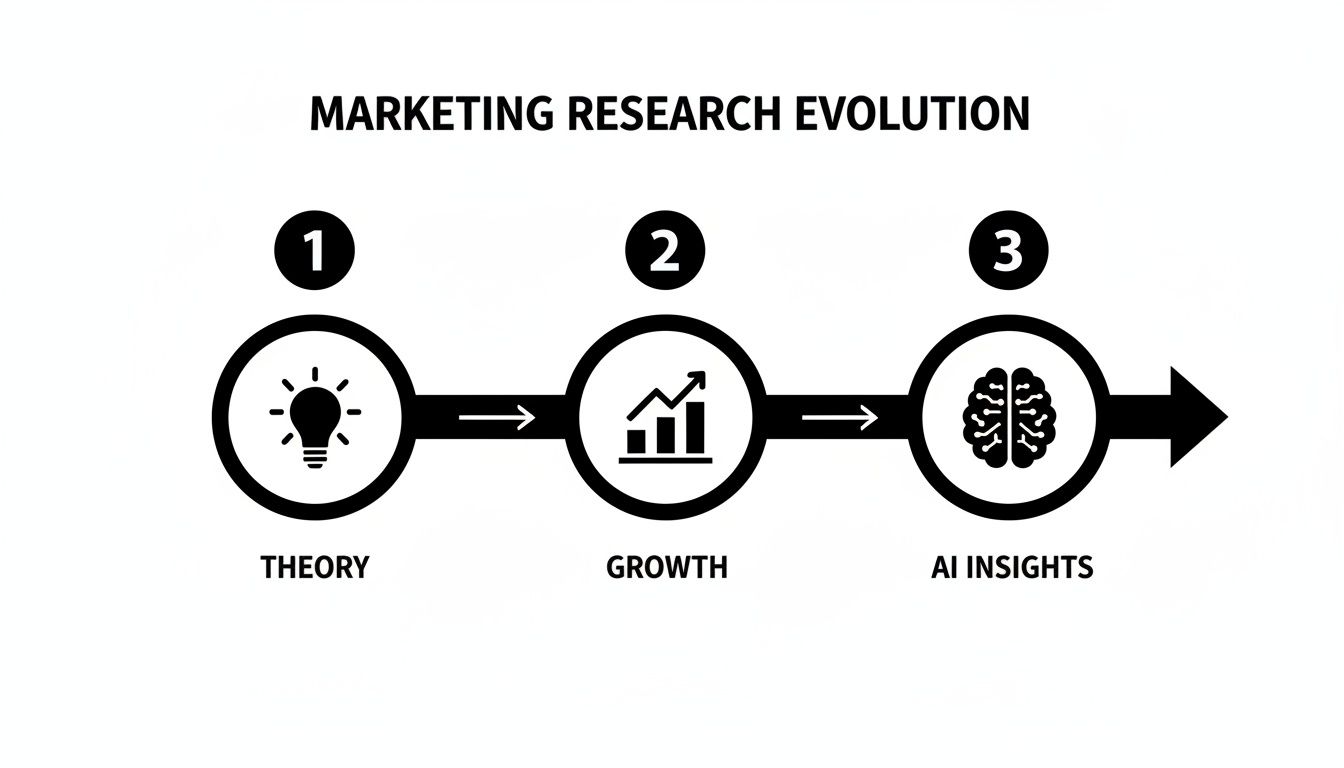 The visualization highlights a clear progression, showing how modern tools now accelerate the path from a simple question to a powerful, data-backed conclusion.
Stage 2: Design Your Research Plan and Strategy
You’ve defined the problem and set your objectives. That was the foundation. Now, it’s time to be the architect. This second stage is where you draw up the blueprint—the detailed plan for how you’ll actually find the answers you need. A solid research plan is what separates a chaotic, resource-draining project from an efficient, insight-generating machine.
Think of it like planning a cross-country road trip. Your destination is the objective you set in stage one. The research design is your map, your choice of vehicle, your budget for gas and food, and your planned stops along the way. Without this plan, you might eventually get there, but you’ll probably take a few wrong turns, run out of gas, and waste a ton of time.
Choosing Your Research Methodology
The first big decision in your plan is picking the right methodology. This really boils down to two main approaches: qualitative and quantitative research. They aren’t mutually exclusive; in fact, the most powerful insights often come from blending them.
- Qualitative Research: The "Why": This is all about exploration. It aims to understand the underlying reasons, opinions, and motivations behind people's actions. Think in-depth interviews, focus groups, or open-ended survey questions. It’s like a detective interviewing witnesses to piece together the full story behind an event. The data you get is rich and descriptive, but you can’t measure it statistically across a huge population.
- Quantitative Research: The "What" and "How Many": This approach is focused on generating hard numbers that can be turned into usable statistics. Think large-scale surveys with multiple-choice questions, A/B tests, or website analytics. It’s like that same detective analyzing city-wide crime stats to spot patterns. It gives you concrete numbers but often lacks the deep, human context you get from qualitative methods.
Your choice here depends entirely on your research objectives. If you want to explore new ideas or understand complex customer feelings, start with qualitative. If you need to validate a hypothesis or measure the scale of an issue, quantitative is your best bet.
A killer strategy is to use qualitative research first to form hypotheses (e.g., "We think customers are churning because of slow support") and then use quantitative research to validate those hypotheses at scale (e.g., "A survey of 500 churned customers shows that 65% cited 'slow support response time' as a primary reason for leaving").
Selecting the Right Research Type
Beyond the qual vs. quant decision, your plan also needs to define the type of research you’ll conduct. There are three primary types, each serving a different purpose.
- Exploratory Research: Use this when you're at the very beginning and don't know much about the problem yet. It’s flexible and designed to help you get a broad understanding. Methods include things like literature reviews, initial interviews, and focus groups.
- Descriptive Research: This is probably the most common type. It aims to describe the characteristics of a population or phenomenon. It answers the classic "who, what, when, where, and how" questions. Surveys and observational studies are the go-to methods here.
- Causal Research: This is the most specific type, designed to figure out cause-and-effect relationships. It answers "what if" questions and often involves controlled experiments, like A/B testing a new pricing model to see its direct impact on conversions.
Creating an Actionable Research Plan
With your methods and types selected, the final step is to get it all down in a formal plan. This document makes sure everyone on your team is aligned and helps keep the project from going off the rails. For a deeper dive into crafting effective questions for your study, our article on survey design best practices offers some great guidance.
Your plan should clearly outline these key components:
- Target Audience (Sample Plan): Who, exactly, are you researching? Define their demographics, firmographics, and behaviors. How will you find and recruit them?
- Data Collection Instruments: What tools will you use? A survey questionnaire, an interview guide, an observational checklist?
- Budget: What are the real costs for tools, participant incentives, and your team's time?
- Timeline: Set clear deadlines for each phase—design, data collection, analysis, and reporting.
This detailed plan turns your objective from a vague idea into a concrete, manageable project. Now you’re ready for the next stage: collecting the data.
Stage 3: Collect High-Quality Data with Modern Tools
You’ve got a solid plan. Now it’s time to move from strategy to execution and get your research in front of real people. This is the stage where you gather the raw information that will eventually become your game-changing insights. How you collect this data directly impacts its quality, which in turn determines how much confidence you can have in your final decisions.
The process usually boils down to two types of data. Primary data is the brand-new information you gather yourself, for this specific project. Think surveys, interviews, or focus groups. Secondary data, on the other hand, is existing information that someone else already collected, like industry reports or government statistics.
A powerful research strategy almost always uses both. You can start with secondary sources to get the lay of the land, then launch a primary collection effort to fill in the specific gaps only your audience can answer.
Primary Data Collection: Modern Efficiency
Gathering primary data is your chance to ask your exact questions to your ideal audience. In the past, this was a logistical nightmare of phone banks and clipboard surveys. Thankfully, technology has transformed this process into a much more efficient machine.
The key is making it dead simple and even engaging for your audience to participate. We’ve all clicked away from a clunky, poorly designed form. Those things are notorious for low completion rates, leaving you with a messy, incomplete dataset. This is where modern tools really shine.
Here are a few of the top tools for pulling in primary data with forms and surveys:
- Orbit AI: This platform turns static forms into dynamic, conversational experiences. Instead of a boring questionnaire, an AI SDR can engage users in real-time, ask intelligent follow-up questions, and even qualify leads as they type. This conversational style dramatically boosts completion rates and helps you gather richer, more nuanced data.
- SurveyMonkey: A household name in the survey world, known for its user-friendly interface and massive template library. It’s a great choice for launching quantitative surveys quickly.
- Google Forms: A free and straightforward option that's perfect for simple questionnaires, quick internal feedback, and other basic data collection needs.
- Jotform: Offers a huge number of templates and more advanced features like conditional logic and integrations, making it suitable for more complex data-gathering projects.

This kind of user-centric design is critical. It reduces the friction that makes people abandon your form and encourages them to give more thoughtful, complete answers.
Writing Unbiased Questions
The tool is only half the battle; the questions you ask are just as important. One biased or leading question can completely invalidate your results.
The goal is neutrality. Your questions should never suggest a "correct" answer or steer the respondent in a certain direction. A biased question like, "Don't you agree that our new feature is amazing?" will only get you skewed, useless feedback.
Instead, frame your questions to be open and objective. You could rephrase that biased question to "How would you describe your experience with our new feature?" or "What are your thoughts on the new feature?" This approach gets you honest answers that reflect how people truly feel. For a deeper dive, you can learn more about the different types of data collection methods in our detailed guide.
Tapping into Secondary Data
Before you invest heavily in a primary research campaign, it's always wise to see what's already out there. Secondary data is often available for free or at a low cost and can provide a wealth of foundational knowledge, saving you a ton of time and effort.
Excellent sources of secondary data include:
- Industry Reports: Publications from firms like Gartner, Forrester, or Nielsen offer deep dives into market trends, consumer behavior, and competitive landscapes.
- Government Data: Agencies like the U.S. Census Bureau, the Bureau of Labor Statistics, and the Small Business Administration provide a treasure trove of demographic and economic data.
- Academic Journals: Platforms like Google Scholar or JSTOR give you access to peer-reviewed studies that can provide deep theoretical and practical knowledge.
- Competitor Analysis: Simply reviewing your competitors' annual reports, press releases, and public statements can reveal key insights into their strategies and performance.
By combining readily available secondary data with your own targeted primary research, you create a much more comprehensive picture. This dual approach ensures your work is built on a foundation of both broad context and specific, proprietary insights, setting you up for a powerful analysis.
Stage 4: Analyze Your Data to Uncover Hidden Insights
So you've done the hard work of collecting your research data. At this point, what you have is a pile of raw material—it’s full of potential, but it’s not a strategy. Think of it like a pile of bricks. You can't live in a pile of bricks, but with the right blueprint, you can build a house. This fourth stage is where you become the architect, transforming raw information into a solid structure of actionable insights.
The journey from a messy spreadsheet to strategic wisdom starts with a step many teams rush through: data cleaning. It isn't glamorous, but it's absolutely critical.
Start with a Clean Slate
Before you can spot a single meaningful trend, your data has to be accurate and reliable. This process, often called data scrubbing, is all about finding and fixing the errors, duplicates, and weird inconsistencies lurking in your dataset.
It’s like a chef meticulously prepping ingredients before starting a meal. You wouldn't just toss unwashed vegetables and random spices into a pot and expect a Michelin-star dish. In the same way, you can't generate reliable insights from messy, chaotic data.
Common cleaning tasks usually involve:
- Removing Duplicates: Making sure one enthusiastic respondent isn't accidentally counted three times.
- Correcting Errors: Fixing typos and standardizing entries (e.g., making sure "USA," "U.S.A.," and "United States" all count as the same thing).
- Handling Incomplete Data: Deciding what to do with responses that have missing answers. Do you remove them or fill in the blanks based on logical assumptions?
- Filtering Outliers: Identifying those one-off responses that are so extreme they could throw off your entire analysis.
This is non-negotiable. Poor data quality isn't just an annoyance; it's expensive. One study found it costs organizations an average of $15 million every year. Taking the time to scrub your data ensures the insights you build are on solid ground.
Analyzing Quantitative Data
With a clean dataset in hand, you can start digging into your quantitative information—the hard numbers from surveys, A/B tests, or analytics platforms. The goal here is to move past individual data points and start seeing the bigger picture.
Statistical analysis doesn't have to be some terrifying, PhD-level exercise. Often, the simplest methods are the most powerful.
- Descriptive Statistics: This just means calculating the basics like the mean (the average), median (the middle value), and mode (the most frequent value) to get a quick summary of your data.
- Cross-Tabulation: This is just a fancy way of saying you compare two or more variables to see if they're connected. For example, you could cross-tabulate customer satisfaction scores against different age groups to see if your younger customers are happier than your older ones.
Visualizing data is one of the fastest ways to make sense of it. A simple bar chart showing customer satisfaction by region is far more intuitive than a table of raw numbers. Tools like Orbit AI’s built-in analytics dashboard can help you see these patterns instantly.
You can learn more about how to get the most out of your data with Orbit AI's advanced analytics features.
Uncovering Stories in Qualitative Data
Now for the fun part. Qualitative data—the rich, contextual feedback from interviews or open-ended survey questions—can’t be plugged into a simple formula. The main technique for making sense of it all is thematic analysis, which is really just a structured way of finding patterns, or themes, in the text.
Imagine you're a detective reading through a stack of witness statements. You're not just reading words; you're looking for recurring ideas, common phrases, and shared emotions that connect the different stories.
The process usually breaks down like this:
- Familiarize Yourself: First, just read through everything. Get a feel for what people are saying without trying to categorize anything yet.
- Generate Initial Codes: Go through it all again, but this time, start highlighting interesting quotes and labeling them with short codes. Think of these as sticky notes, like "slow support" or "confusing UI."
- Search for Themes: Now, start grouping your codes into broader, overarching themes. Your codes for "slow support," "unhelpful agents," and "long wait times" might all roll up into a larger theme called "Poor Customer Service."
- Review and Refine: Finally, take a step back and look at your themes. Do they accurately represent the data? Do they tell a coherent and compelling story?
This method helps you find the powerful "why" behind the numbers, turning a collection of individual comments into strategic wisdom that can genuinely guide your next move.
Stage 5: Present Findings and Drive Decisive Action
 Raw data has potential, but insights have real power. This final stage is where you transform all that careful analysis into a catalyst for genuine business change.
Let’s be honest: an unread report or a confusing presentation is just as useless as doing no research at all. This is your moment to connect the dots, build a case, and guide your organization toward decisive, evidence-backed action.
The goal here is to move beyond simply reporting what you found. It’s time to advocate for what the business should do next. Think of your report not as a history lesson, but as a strategic roadmap for the future.
From Data Points to a Compelling Story
Stakeholders and executives are busy. They don’t have the time or the patience to wade through dense spreadsheets or academic-style papers. To make your findings stick, you have to wrap them in a compelling narrative. Storytelling is what turns abstract numbers into something memorable and relatable.
Instead of just showing a chart, frame it within a story. Start with the initial business problem (the hero's challenge), walk through the key insights you uncovered (the plot twists), and end with your recommendations (the resolution). This simple structure makes complex information far easier for a non-researcher to digest and remember.
A great report or presentation should always include:
- An Executive Summary: Start with the punchline. Put the most important information right up front—the original problem, your key findings, and your top recommendations.
- A Clear Methodology Section: Briefly explain how you did the research. This isn’t about showing off, it’s about building credibility and proving your conclusions are based on a sound process.
- Visualized Data: Use charts, graphs, and infographics to make patterns instantly obvious. A single, well-designed visual can communicate a trend faster than a full page of text ever could.
- Direct Quotes: If you did qualitative research, sprinkle in a few powerful quotes. They add a human element and emotional weight that pure data often lacks.
Crafting Actionable Recommendations
This is where the rubber meets the road. A weak recommendation merely states an observation. A strong one proposes a specific action with a clear, predicted outcome. Your job is to translate the insights into concrete next steps.
Don't just report the 'what'; prescribe the 'now what.' The best research reports don't just answer questions—they create a clear mandate for action, complete with expected outcomes and next steps.
Think about the difference in impact between these two approaches:
| Vague Finding (The "What") | Actionable Recommendation (The "Now What") |
|---|---|
| "Some users expressed frustration with our support hours." | "Implement 24/7 chat support to reduce churn by an estimated 15% among our highest-value enterprise customers, who are most affected by this issue." |
| "Our brand awareness is lower than Competitor X." | "Launch a targeted digital ad campaign on LinkedIn focused on our key differentiators to increase top-of-mind awareness by 20% within six months." |
By tying your recommendations to specific business metrics and outcomes, you transform your research from an interesting report into an indispensable strategic document. This is what makes the entire marketing research journey a powerful engine for growth, ensuring your hard-won insights don't just inform but actively shape the future of your company.
Answering Your Top Marketing Research Questions
Even the most buttoned-up research plan hits a few bumps. Questions always pop up. Getting ahead of the common ones means you can navigate the marketing research stages with confidence, sidestepping the usual pitfalls that trip up even experienced teams.
Here’s a look at the questions we hear most often.
How Long Should Each Stage Take?
There's no one-size-fits-all answer here. The timeline for your research project depends entirely on its scope and complexity. A quick pulse survey to check customer sentiment might be done and dusted in a couple of weeks, while a deep-dive market analysis could easily eat up an entire quarter.
But if you need a ballpark estimate, here’s a rough guide:
- Stage 1 (Problem Definition): Give this a few days up to two weeks. Don't rush it. If you get the problem wrong, everything that follows is a waste of time and money.
- Stage 2 (Research Design): Plan for one to two weeks. This is where you thoughtfully map out your methods, target audience, and resources.
- Stage 3 (Data Collection): This is usually the longest part of the journey. It can be as short as a week for a simple survey or stretch into several months for in-depth interviews or ethnographic studies.
- Stage 4 & 5 (Analysis & Reporting): Typically, this takes one to three weeks combined. It’s where you dig into the data, find the story, and build a compelling narrative for stakeholders.
What are the Most Common Mistakes to Avoid?
Countless research projects get derailed by the same handful of preventable errors. Just knowing what they are is half the battle.
The biggest culprit is a poorly defined research problem—it’s the original sin of bad research and guarantees your findings will be irrelevant. Another classic mistake is writing biased questions that subtly nudge respondents toward the answer you want to hear.
Choosing the wrong sample size or audience is also a huge one; it makes your data unrepresentative and completely misleading. And finally, a surprisingly common failure is presenting a mountain of data without any clear, actionable recommendations, leaving everyone in the room asking, "So what?"
How Can AI Improve the Research Process?
AI is a massive force multiplier here, capable of dramatically speeding up several research stages while improving the quality of your insights. Think of it as your tireless research assistant.
For example, a platform like Orbit AI completely changes the data collection game. Instead of static, boring forms, it uses conversational forms that feel more like a natural chat, which can seriously boost your completion rates. Its AI SDR capabilities can even pre-qualify respondents as they type, ensuring the data you collect is high-quality from the get-go.
When it comes to analysis, AI can tear through huge volumes of open-ended text responses in minutes, identifying sentiment and key themes that would take a human analyst days to manually code and categorize.
By handling the heavy lifting of data collection and initial processing, AI frees up your team to focus on what matters most: strategic interpretation and crafting impactful recommendations.
Primary vs. Secondary Research: What’s the Difference?
Getting this distinction right is fundamental to designing a smart, efficient study.
Primary Research: This is brand-new data you collect yourself for your specific project. Think surveys, interviews, and focus groups. It’s custom-tailored to answer your exact questions but tends to be more expensive and time-consuming.
Secondary Research: This is when you use existing data that someone else has already gathered. This includes industry reports, government statistics, or academic studies. It’s a fantastic way to get foundational knowledge quickly and cost-effectively, though it might not be specific enough to answer your core questions completely.
The strongest research projects almost always blend the two. You start with secondary data to understand the broad landscape, then deploy primary research to get specific, proprietary insights that your competitors don’t have.
Ready to transform your data collection from a static form into a qualified conversation? Orbit AI helps high-growth teams capture and qualify leads with less friction and more insight. Start building smarter forms for free and see how our AI-powered platform can help you close deals faster.


