
If you can't measure your marketing, you can't prove it worked. It's a simple truth that trips up countless campaigns.
A brilliant creative concept and pinpoint-accurate targeting mean very little if, at the end of the quarter, you can't connect your efforts to actual business results. The problem usually starts before a single dollar is spent: defining success after the campaign is already live, not before.
Without a clear destination, you're just driving blind.
Defining Your Campaign's North Star
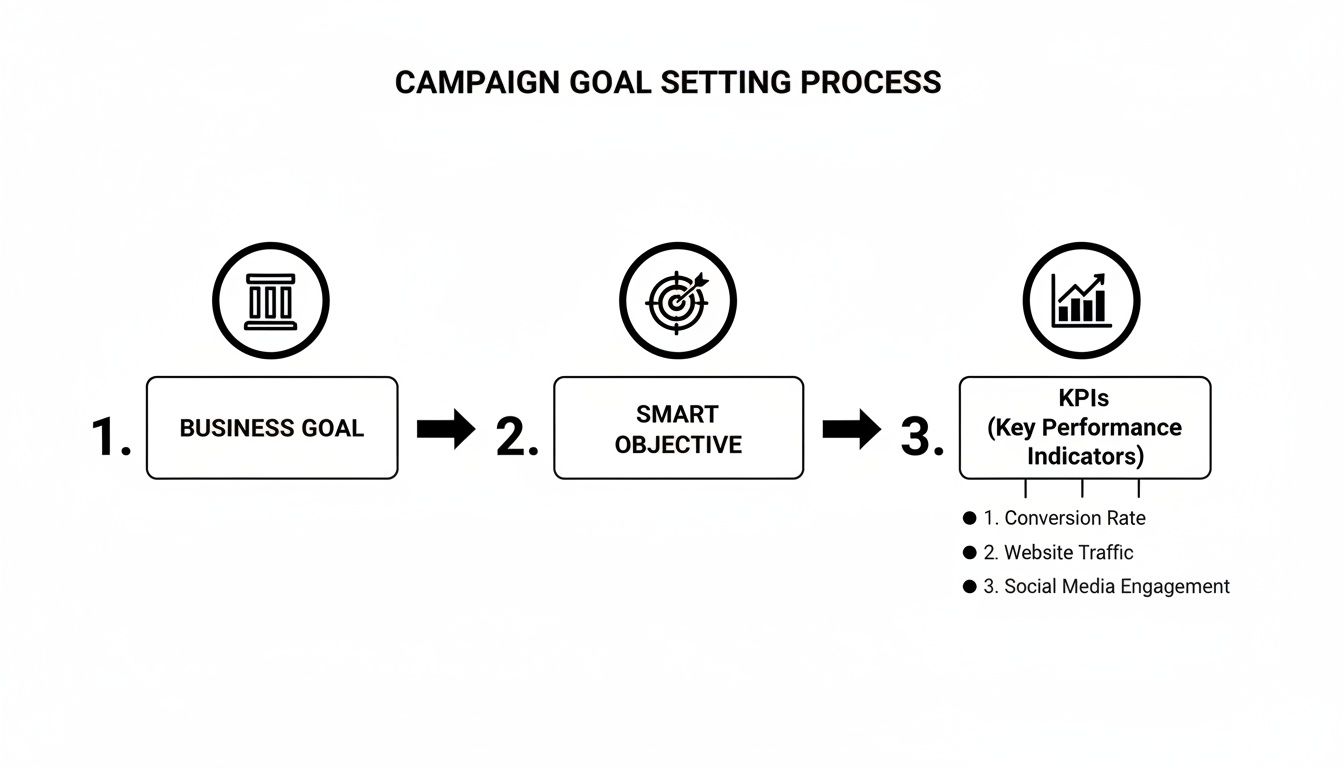
Most marketing measurement fails at the starting line, not the finish line. We get so wrapped up in execution that we forget to define what "winning" actually looks like.
Effective measurement starts by ditching ambiguous goals like "more leads" or "increased brand awareness." These are hopes, not objectives. What you need is a North Star—a single, guiding metric that aligns every marketing activity with a tangible business result. This simple shift transforms your campaign from a hopeful experiment into a strategic investment.
From Vague Hopes to SMART Objectives
The best way to find that clarity is by filtering your goals through the SMART framework. It’s a classic for a reason. It forces every objective to be Specific, Measurable, Achievable, Relevant, and Time-bound. It’s the difference between wishful thinking and a powerful, actionable target.
Let’s look at a real-world example:
- Vague Hope: Get more leads from our Q3 webinar.
- SMART Objective: Generate 250 Marketing Qualified Leads (MQLs) from our Q3 webinar campaign by September 30th, at a Cost Per Lead (CPL) under $75.
See the difference? This level of detail gives your team a precise definition of victory. They know the exact target (250 MQLs), the budget constraint ($75 CPL), and the deadline (September 30th). Every decision, from ad copy to channel selection, can now be weighed against this specific outcome.
To get even sharper on who those MQLs should be, you might explore our guide on how to create buyer personas to ensure you're targeting the most valuable leads from the start.
Connecting Marketing KPIs to Business Goals
A great marketing objective doesn't live on an island; it serves a larger business purpose. The ultimate goal of marketing isn't just to generate leads—it's to drive revenue. Your campaign goals have to act as a bridge between your team's activities and the company's financial health.
A campaign's success isn't measured by how busy the marketing team was, but by the tangible impact it had on the business's bottom line. Tying every marketing KPI back to revenue is the only way to prove its true value.
To make this connection, you have to think in terms of two distinct types of Key Performance Indicators (KPIs):
Leading KPIs: These are your in-flight, predictive metrics that suggest you're on the right track. Think of them as early warning signals. Examples include Click-Through Rate (CTR), Cost Per Click (CPC), and landing page conversion rates. A rising CTR, for instance, signals your ad creative is resonating.
Lagging KPIs: These are the outcome-focused metrics that prove the campaign actually hit its business objective. They are the final verdict on performance. Examples here are Return on Ad Spend (ROAS), Customer Acquisition Cost (CAC), and the number of MQLs generated.
A classic mistake is to get obsessed with leading indicators. A high CTR feels great, but if those clicks don't convert into qualified leads that eventually close, the campaign is still a failure.
A smart measurement framework uses leading KPIs for mid-flight optimization and lagging KPIs for the final performance review. This foundational step creates a system that guides every decision, justifies your budget, and proves marketing's role as a true revenue engine.
Building Your Data and Tracking Infrastructure
Okay, you've got your goals locked in. Now comes the part that makes or breaks your ability to measure anything: building the technical foundation to actually track performance.
Without a solid data and tracking infrastructure, even the most brilliant KPIs are just wishful thinking. This is where you connect your marketing activities to tangible data points, creating a clean, reliable stream of information that tells you what’s working and what isn’t.
Think of it like building a house. You wouldn’t put up walls without pouring a solid foundation first. Launching a campaign without proper tracking is the same—it just leads to messy data, wrong conclusions, and a whole lot of wasted budget.
The goal is to create a clear line of sight from your high-level business objectives all the way down to the specific metrics you’ll capture, like this:
This process ensures your data collection is always purposeful and directly tied to what the business actually cares about.
Mastering UTM Parameters for Source Tracking
First up, and this is non-negotiable: you have to master Urchin Tracking Module (UTM) parameters. These are just simple bits of text you add to the end of a URL that tell your analytics tools exactly where a visitor came from. Consistent UTM usage is the bedrock of effective source tracking. It’s what lets you attribute conversions with precision.
Without them, all your traffic from social, email, and paid ads gets dumped into one big, messy bucket. Good luck figuring out which channel delivered the best results.
For every single campaign link, you should be using these essential UTMs:
- utm_source: Identifies the platform, like
google,facebook, ornewsletter. - utm_medium: Specifies the marketing channel, such as
cpc,social, oremail. - utm_campaign: Names the specific campaign, like
q3-webinarorsummer-sale-2024.
A clean, tagged URL looks something like this: yourwebsite.com/landing-page?utm_source=linkedin&utm_medium=cpc&utm_campaign=q3-webinar. Instantly, you know that click came from a paid LinkedIn ad for your Q3 webinar. No guesswork needed.
Pro Tip: Create a simple spreadsheet that defines your team's UTM naming conventions. Enforcing a strict, consistent system from the start will save you countless hours of data cleanup down the road.
Installing Pixels and Defining Conversion Goals
Next, you need to get your tracking pixels installed correctly. These are small snippets of code from platforms like Google and Meta that you place on your website. They're critical for tracking user actions, building retargeting audiences, and reporting conversions back to the ad platforms.
A correctly installed pixel is what allows you to see exactly how many people who clicked your ad went on to fill out a form or make a purchase. It's the key to measuring marketing campaign effectiveness right inside your ad managers.
At the same time, you need to define these actions as conversion goals in your main analytics platform, like Google Analytics 4. This might be as simple as tracking visits to a "thank-you" page after a form submission or monitoring a specific button click. When your ad platform pixels and your analytics goals are aligned, you get a single, cohesive view of performance across your entire ecosystem.
Integrating Your Tech Stack for a Single Source of Truth
Finally, remember that your tracking setup is only as strong as the connections between your tools. Data silos are the enemy of accurate measurement. When your form tool doesn't talk to your CRM, or your CRM doesn't sync with your analytics, you lose the full customer story.
For instance, connecting an intelligent form platform like Orbit AI directly to your CRM ensures lead data flows through seamlessly. This simple integration creates a single source of truth, enriching every new lead with its original campaign source from the very first touchpoint. To see how this works, check out our documentation on form submission tracking and analytics.
This kind of connection eliminates manual data entry and gives you a crystal-clear view of which campaigns are actually generating high-value leads that turn into revenue.
Choosing the Right Marketing Attribution Model
Once you have all your tracking in place, you hit the next big challenge: figuring out what’s actually working. A customer's journey is rarely a straight line from A to B. It’s more like a winding path with lots of stops along the way.
They might see one of your social media posts, click a search ad a week later, and finally buy something after getting an email campaign. So, which one gets the credit for the sale? This is the core question that marketing attribution models are built to answer.
Picking the right model is a huge deal. It directly shapes your understanding of which channels are valuable and, in turn, where you decide to spend your money. If you get this wrong, you could end up cutting the budget for a channel that’s quietly bringing in new customers, all while pouring more cash into the one that just happens to get the last click.
Single-Touch vs. Multi-Touch Attribution
The most straightforward way to handle attribution is to give 100% of the credit to a single touchpoint. These models are popular because they’re simple to set up and easy to understand, especially for businesses with shorter sales cycles.
- First-Touch Attribution: This model gives all the credit to the very first interaction someone has with your brand. It’s fantastic for figuring out which channels are your best demand-generation engines—the ones filling the top of your funnel.
- Last-Touch Attribution: On the flip side, this model gives all the credit to the final touchpoint right before a conversion. It’s great for identifying which channels are most effective at closing the deal, making it a favorite for e-commerce brands focused on driving immediate sales.
But here's the catch: while simple, these models ignore every other valuable interaction that happened in between. They don't tell the whole story. To get a clearer picture, it's essential to understand the different ways you can go about collecting marketing data from the entire customer lifecycle.
Exploring More Nuanced Multi-Touch Models
For any business with a longer, more complex sales cycle—which is most B2B companies—multi-touch models offer a far more balanced view by spreading credit across several interactions. Before you choose one, understanding what is multi-touch attribution is key to making sure you assign credit in a way that makes sense for your business.
Here are a few of the most common multi-touch models:
- Linear: This is the simplest of the multi-touch models. It just splits the credit equally across every single touchpoint in the customer's journey. From the first ad they saw to the final email they clicked, every interaction gets the same weight.
- Time-Decay: This model operates on the idea that the touchpoints closest to the sale were the most influential. It gives more credit to the interactions that happened right before the conversion and less to those that happened earlier on.
- Position-Based (or U-Shaped): This is a popular hybrid model. It typically gives 40% of the credit to the first touch and 40% to the last one, then spreads the remaining 20% evenly across all the interactions in the middle. It values both the channel that first brought someone in and the one that finally sealed the deal.
The goal isn't to find the one "perfect" attribution model. It's about choosing the model that best maps to your unique customer journey and business goals, giving you the most useful insights to optimize where you spend your money.
The Rise of Data-Driven Attribution
The most sophisticated approach today is data-driven attribution. Instead of just following a pre-set rule like the other models, this one uses machine learning to crunch the numbers on all your converting and non-converting customer paths.
It then assigns credit to each touchpoint based on its actual, calculated impact on driving a conversion. It takes the guesswork completely out of the equation.
This model might reveal that a mid-funnel blog post is way more influential than a Linear or U-shaped model would ever suggest. Platforms like Google Analytics 4 now use data-driven attribution as their default setting, which has made this powerful method more accessible than ever before. With these kinds of insights, you can confidently shift your budget to the channels that are truly moving the needle, not just the ones that happen to show up first or last in the journey.
Analyzing Performance and Proving True Lift
You've done the hard work of setting up your tracking. The data is clean, it's flowing, and your instrumentation is humming along. Now comes the fun part: turning all those numbers into a story that proves your marketing isn't just an expense—it's a revenue engine.
This is where you move past surface-level metrics like clicks and impressions and start talking the language of the C-suite. It all boils down to connecting your campaign activities directly to dollars and cents.

Calculating Your Return on Ad Spend
When it comes to paid campaigns, Return on Ad Spend (ROAS) is your North Star. It’s the clearest, most direct measure of profitability, answering one simple question: for every dollar we put in, how many did we get back?
The formula itself couldn't be simpler:
ROAS = Total Revenue from Campaign / Total Ad Spend
Let's say you ran a Google Ads campaign and spent $5,000. If that campaign directly generated $20,000 in sales, your ROAS is 4:1. That means you earned $4 for every $1 you spent. Simple, powerful, and impossible to argue with.
This isn't just about looking good in a report. A Nielsen study found that brands that master ROAS analysis see 28% higher profitability on average. It's the key to knowing which levers to pull and where to double down on your budget.
ROAS is fantastic for measuring the immediate impact of your paid channels. But it's only one half of the story. It tells you what happened now, not what a customer is worth over the long haul. That's where CLV comes in.
To truly understand the tangible impact and financial return of your efforts, learn how to accurately measure marketing ROI for real business growth.
Understanding Customer Lifetime Value
Customer Lifetime Value (CLV) is the metric that separates tactical marketers from strategic ones. It forecasts the total revenue you can expect to earn from a single customer over their entire relationship with your business.
So, why does this matter for campaign measurement? Because not all customers are created equal. A campaign might have a mediocre ROAS upfront but acquire customers who stick around for years, making repeat purchases and becoming incredibly profitable over time.
Imagine you have two campaigns running:
- Campaign A: Spends $100 per acquired customer, and those customers have an average CLV of $2,000.
- Campaign B: Spends just $50 per acquired customer, but their average CLV is only $300.
At first glance, Campaign B looks twice as efficient—half the acquisition cost! But when you look at CLV, you realize Campaign A is the real growth driver, bringing in customers who are nearly 7x more valuable over their lifetime. This insight helps you avoid the trap of optimizing for cheap, low-quality leads that churn out quickly.
Proving Incremental Lift with Control Groups
This is the ultimate challenge for any marketer: did my campaign cause these sales, or would a chunk of them have happened anyway? Answering this question is how you prove true, causal impact. It's called lift analysis.
The concept is straightforward. You split your target audience into two groups:
- Test Group: This group sees your marketing campaign—your ads, your emails, your content.
- Control Group: This group is intentionally held back and does not see the campaign.
You then compare the conversion rate of the test group to the control group. The difference is your incremental lift—the conversions that happened only because of your marketing efforts.
If your test group converted at 5% and your control group converted at 2%, your campaign generated a 3% lift. This is undeniable proof that your work created new demand, not just captured people who were already on their way to buy.
Clean data is non-negotiable here. Accurate https://orbitforms.ai/blog/form-submission-tracking-and-analytics is what makes this comparison possible, giving you the reliable conversion numbers you need from both groups. When you can walk into a meeting and say, "Our campaign drove a measurable 3% lift in sales above our baseline," you've officially mastered the art of proving your value.
Using Advanced Form Analytics to Nail Your Conversions
Think about it: your forms and landing pages are the final handshake. This is the moment of truth where a curious prospect decides to either engage or walk away. You could have the most brilliant marketing campaign in the world, but a clunky or confusing form acts like a brick wall right at the finish line, completely killing your conversion rates.
That's where advanced form analytics comes in. It turns this critical touchpoint from a simple data bucket into a powerful diagnostic tool. By looking past basic submission counts, you can finally see the hidden friction points that are quietly costing you leads and revenue.

Find the Friction with Field-by-Field Analysis
Traditional analytics might tell you a landing page has a low conversion rate, but they never tell you why. This is exactly where modern form analytics platforms change the game. They give you incredibly granular, field-by-field insights that reveal precisely where users are getting stuck.
What you should be looking for:
- Drop-off Rates: Which specific field is making people give up? If you see a massive drop-off on the "Phone Number" field, it’s a huge red flag. That field probably isn’t essential and should be axed.
- Time-to-Complete: How long are people hovering over each field? If a supposedly simple question is taking an unusually long time, it’s likely confusing or poorly worded.
- Correction Rates: Which fields do users have to constantly edit? High correction rates often point to confusing formatting requirements or frustrating validation errors.
By diagnosing these exact friction points, you can make changes backed by real data—like shortening your form, clarifying labels, or just ditching non-essential fields. These small tweaks can have a massive impact on your completion rates. For a deeper look, check out our guide on form analytics and tracking tools.
The Rise of AI in Lead Qualification
Okay, so fixing friction is one thing. The next evolution is using artificial intelligence to understand the quality of a lead the second they hit "submit." This flips your form from a passive collection tool into an active qualification engine, giving you an immediate pulse on your campaign's effectiveness.
This is where an AI Sales Development Representative (AI SDR) really shines. It gets to work the instant a user submits a form. Instead of just dumping raw data into your CRM, an AI SDR can:
- Instantly Qualify Leads: It cross-references submission data with your ideal customer profile to score the lead on the spot.
- Enrich Data: It can pull in firmographic data like company size, industry, and revenue to paint a much richer picture of the prospect.
- Score and Route: It assigns a lead score based on all this info and automatically routes the hot leads straight to the right sales rep for immediate follow-up.
This instant feedback loop is a total game-changer for measuring marketing effectiveness. You no longer have to wait weeks for sales to tell you a channel is sending junk leads. You see it the moment the form is filled out.
Connecting Form Data Back to Campaign Performance
With this level of intelligence, you can start segmenting lead quality by its source. You might discover that while your LinkedIn ads are bringing in a ton of form fills, the leads from organic search are converting to sales-qualified at a much higher rate.
This is the kind of insight that lets you reallocate your budget with confidence. You can double down on the channels that deliver not just leads, but sales-ready leads.
Here's a look at some of the top tools helping marketers turn their forms into intelligent conversion points.
Top AI Form and Lead Qualification Tools
This table breaks down some of the modern tools designed to enhance lead capture, qualification, and form analytics. It will help you choose the best platform to measure and improve the effectiveness of your conversions.
| Tool | Key Feature | Best For |
|---|---|---|
| Orbit AI | AI-powered conversational forms and real-time lead qualification (AI SDR). | Businesses wanting to instantly qualify, enrich, and route leads while improving form completion rates. |
| Clearbit Forms | Shortens forms by auto-populating fields with company data based on an email address. | B2B marketers focused on reducing friction and capturing high-quality firmographic data. |
| Chili Piper | Automates lead routing and meeting scheduling directly from the form submission. | Sales-driven teams looking to accelerate speed-to-lead and book meetings with qualified prospects instantly. |
| Zuko Analytics | In-depth form analytics platform that tracks user behavior on a field-by-field basis. | Marketers and UX designers who need to diagnose and fix underperforming web forms. |
Ultimately, by treating your forms as a dynamic part of your measurement strategy—not just an endpoint—you unlock a deeper layer of insight. You create a clear, undeniable line connecting your marketing spend directly to the quality of your sales pipeline.
Common Questions on Measuring Campaign Effectiveness
As you start putting these measurement frameworks to work, questions are bound to pop up. Let's be honest, the real world of marketing is messy. Data doesn't always behave the way you expect.
Getting ahead of the most common questions will save you some serious headaches and help you navigate the practical challenges of proving your campaign’s value. This section tackles some of the tricky situations and frequent questions that come up time and time again.
What Are the Most Important KPIs to Track?
This is the million-dollar question, and the answer is simpler than you might think: it completely depends on your campaign's primary goal.
There’s no magic, one-size-fits-all list of KPIs. Trying to track everything is a surefire way to understand nothing. The whole point is to tie your metrics directly back to your objective.
Here's how that looks in the wild:
- Brand Awareness: If you're launching a campaign to get your name out there, you'll want to live and breathe metrics like Impressions, Reach, and Share of Voice.
- Lead Generation: For campaigns designed to fill the pipeline, your North Star metrics are going to be Cost Per Lead (CPL), Conversion Rate, and the raw number of Marketing Qualified Leads (MQLs).
- E-commerce Sales: When you're driving direct purchases, nothing matters more than Return on Ad Spend (ROAS) and Customer Acquisition Cost (CAC).
Pick one primary "North Star" metric that directly reflects your main objective. Then, back it up with two or three secondary KPIs. These give you the context you need to figure out what’s working and what isn’t along the way.
How Often Should I Report on Campaign Performance?
Your reporting cadence should match the speed at which you can actually make meaningful decisions. Reporting too often leads to knee-jerk reactions based on incomplete data. But wait too long, and you’ll miss crucial opportunities to optimize.
Here’s a balanced approach that works for most teams:
- Daily or Weekly Checks: For fast-moving digital ad campaigns, you need to keep a close eye on the leading indicators. This is where you monitor things like CTR, CPC, and CPA for quick, in-flight adjustments to creative or bidding strategies.
- Monthly Reviews: This is where you bring the lagging indicators to stakeholders. Monthly meetings are the perfect time to discuss bigger-picture results like ROAS, overall pipeline influence, and how you’re tracking toward quarterly MQL targets.
- End-of-Campaign Analysis: Once the dust settles, a comprehensive final report should tie everything together. This is your moment to measure the campaign's total impact against the original SMART goals you set from the very beginning.
Sticking to a consistent schedule keeps you from getting lost in the data weeds and helps you focus on insights that actually drive action.
What Should I Do If My Conversion Tracking Is Inaccurate?
First, don't panic. Inaccurate tracking can completely undermine your measurement efforts, so it's a top priority to fix, but it's almost always fixable. You just need a systematic process to hunt down the problem.
Start by using tools like Google Tag Assistant to confirm your tracking codes and pixels are installed and firing correctly on all the right pages. A missing tag on a thank-you page is one of the most common culprits.
Next, dive into your analytics platform and double-check the goal configurations themselves. Is the destination URL for a conversion event correct? Are the event parameters set up properly? A simple typo here can break everything.
Then, do a thorough review of your UTM parameter usage across all campaign links. Inconsistent naming conventions—like using linkedin in one ad and LinkedIn in another—can split your data, making accurate analysis impossible.
Finally, pull the conversion numbers from your ad platforms and compare them against the data in your CRM. If there's a huge discrepancy, you know there’s a break somewhere in the data chain. This is where using tools with direct, native CRM integrations becomes so valuable, as they ensure end-to-end data integrity from the first click to the final sale.
Ready to turn every form submission into a qualified conversation? Orbit AI uses an AI SDR to instantly qualify, enrich, and score leads, giving you a real-time pulse on campaign quality. Start building for free and see what better data can do for your marketing effectiveness.


